भारत सरकार | GOVERNMENT OF INDIA
 |
|
Interesting Facts
1. IIP
In the year 2023-24, the Index of Industrial Production (IIP) for Chemicals and Chemical Products (Base Year: 2011-12) stood at 127.4, reflecting a 1.5% decrease over the preceding year, 2022-23.
Annual NIC-2 digit and sectoral indices of industrial production
| NIC 2008 | Description | Weights | 2015-16 | 2016-17 | 2017-18 | 2018-19 | 2019-20 | 2020-21 | 2021-22 | 2022-23 | 2023-24 |
|---|---|---|---|---|---|---|---|---|---|---|---|
| 20 | Manufacture of chemicals and chemical products | 7.87 | 113.7 | 116.5 | 116.1 | 119.0 | 118.5 | 116.0 | 121.0 | 129.3 | 127.4 |
| Manufacturing | 77.63 | 115.9 | 121.0 | 126.6 | 131.5 | 129.6 | 117.2 | 131.0 | 137.1 | 144.7 | |
| General | 100.00 | 114.7 | 120.0 | 125.3 | 130.1 | 129.0 | 118.1 | 131.6 | 138.5 | 146.7 | |
Table: Index of Industrial Production (IIP) for Chemicals and Chemical Products
Annual NIC-2 digit and sectoral growth rates as per IIP (%) calculated w.r.t. previous year
| NIC 2008 | Description | Weights | 2015-16 | 2016-17 | 2017-18 | 2018-19 | 2019-20 | 2020-21 | 2021-22 | 2022-23 | 2023-24 |
|---|---|---|---|---|---|---|---|---|---|---|---|
| 20 | Manufacture of chemicals and chemical products | 7.8730 | 4.1 | 2.5 | -0.3 | 2.5 | -0.4 | -2.1 | 4.3 | 6.9 | -1.5 |
| Manufacturing | 77.6332 | 2.8 | 4.4 | 4.6 | 3.9 | -1.4 | -9.6 | 11.8 | 4.7 | 5.5 | |
| General | 100.00 | 3.3 | 4.6 | 4.4 | 3.8 | -0.8 | -8.4 | 11.4 | 5.2 | 5.9 | |
Table: Annual NIC-2 digit and sectoral growth rates as per IIP (%) calculated w.r.t. previous year

2. WPI
The Wholesale Price Index (WPI) for Chemicals and Chemical Products has shown a rising trend since 2020-21, peaking at 145.4 in the financial year 2022-23. However, in 2023-24, the WPI declined to 136.9, marking a reduction from the previous year's highest point in the last decade.

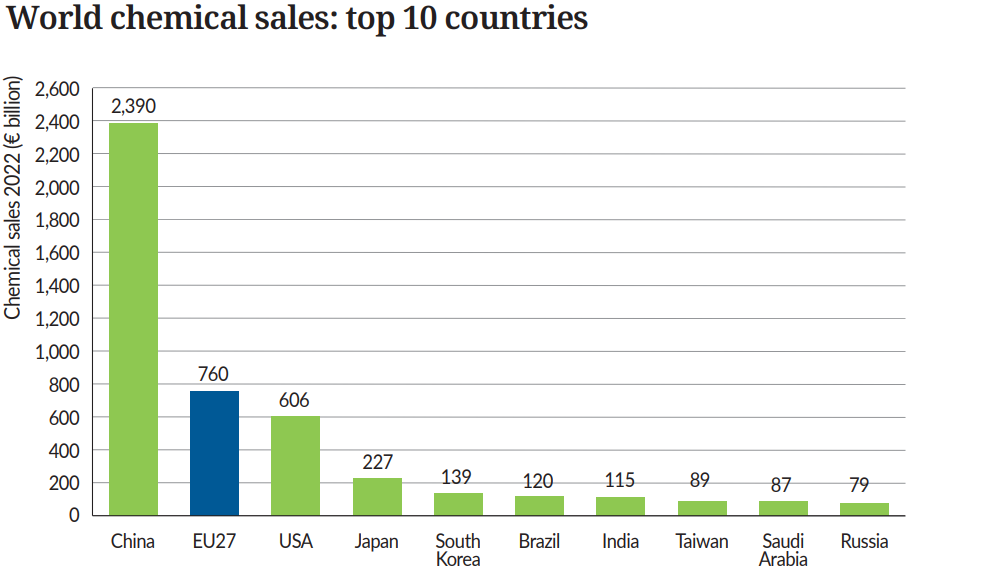
3. World Chemical Sales
As per the Cefic (The European Chemical Industry Council) Facts and Figures report for 2023, India ranks 7th globally and ranks 4th in Asia in chemical sales valued at €115 billion, accounting for 2% of the total worldwide chemical sales.
| Rank | Country/Region | Sales in 2022 |
|---|---|---|
| 1 | China | 2390 |
| 2 | EU27 | 760 |
| 3 | USA | 606 |
| 4 | Japan | 227 |
| 5 | South Korea | 139 |
| 6 | Brazil | 120 |
| 7 | India | 115 |
| 8 | Taiwan | 89 |
| 9 | Saudi Arabia | 87 |
| 10 | Russia | 79 |
Table: Top 10 countries in world chemical sales
4. World Export and Import of Chemicals
India plays a significant role in both world Imports and Exports. It holds the 4th position globally in imports under chapters 29, 54 and EXIM 4002, while it ranks 5th and 4th in Exports under chapters 54 and 55 respectively of the ITC HS codes.
| HS Code | Commodity | India shares in World Export (%) | Rank in the World | India shares in World Import (%) | Rank in the World |
|---|---|---|---|---|---|
| 28 | INORGANIC CHEMICALS | 1.9 | 14 | 5.9 | 3 |
| 29 | ORGANIC CHEMICALS | 4.3 | 7 | 5.5 | 4 |
| 32 | TANNING OR DYEING | 3.7 | 10 | 4.5 | 5 |
| 38 | MISCELLANEOUS CHEMICAL PRODUCTS. | 2.5 | 12 | 2.7 | 10 |
| 39 | PLASTIC AND ARTICLES THEREOF | 1.1 | 23 | 3.4 | 7 |
| 4002 | SYNTHETIC RUBBER AND FACTICE | 0.7 | 23 | 4.8 | 4 |
| 54 | MAN-MADE FILAMENTS | 3.5 | 5 | 5.0 | 4 |
| 55 | MAN-MADE STAPLE FIBRES | 5.0 | 4 | 3.5 | 9 |
Table 4: World Export and Import of Chemicals 2023
Source: http://comtrade.un.org./ (UN Comtrade Database)

5. Foreign Direct Investment
The FDI inflow in the chemical sector for 2023-2024 is ₹6985 crore, which accounts for 1.90% of the total FDI inflows. This marks a decline compared to the previous year's share of 2.59% in 2022-2023.

In the financial year 2023-24, the FDI equity inflow for the chemical sector (excluding fertilizers) is recorded at 3%.
6.Gross Value Added
In 2022-23, the GVA share of chemical and chemical products was 1.4% of all economic activities and 9.8% of the manufacturing sector at current prices. At constant prices (2011-12), it was 1.6% and 9.5%, respectively, reflecting the sector's steady contribution to the economy.
At Current Prices (Rs. in Crore)
| Description | 2016-17 | 2017-18 | 2018-19 | 2019-20 | 2020-21 | 2021-22 | 2022-23 |
|---|---|---|---|---|---|---|---|
| GVA of Chemical and chemical products | 208593 | 224595 | 250032 | 265747 | 285458 | 311203 | 346336 |
| GVA Manufacturing | 2333721 | 2566623 | 2812560 | 2705101 | 2803495 | 3392605 | 3536461 |
| GVA at basic prices for All Economic activities | 13965200 | 15505665 | 17175128 | 18381117 | 18210997 | 21635584 | 24659041 |
| Share of GVA of Chemical and chemical products in GVA for All Economic Activities | 1.5% | 1.4% | 1.5% | 1.4% | 1.6% | 1.4% | 1.4% |
| Share of GVA of chemical and chemical products in GVA for Manufacturing Sector | 8.9% | 8.8% | 8.9% | 9.8% | 10.2% | 9.2% | 9.8% |
At Constant Price (2011-12) (Rs. in Crore)
| Description | 2016-17 | 2017-18 | 2018-19 | 2019-20 | 2020-21 | 2021-22 | 2022-23 |
|---|---|---|---|---|---|---|---|
| Industry Division 20: Chemical and chemical products (Corporate + Household) | 123892 | 127364 | 146876 | 173961 | 191504 | 233111 | 238195 |
| GVA Manufacturing | 2054764 | 2209428 | 2328992 | 2259706 | 2329160 | 2561033 | 2504663 |
| GVA at basic prices for All Economic activities | 11328285 | 12034171 | 12733798 | 13236100 | 12687345 | 13876840 | 14804901 |
| Share of GVA of Chemical and chemical products in GVA for All Economic Activities | 1.1% | 1.1% | 1.2% | 1.3% | 1.5% | 1.7% | 1.6% |
| Share of GVA of chemical and chemical products in GVA for Manufacturing Sector | 6.0% | 5.8% | 6.3% | 7.7% | 8.2% | 9.1% | 9.5% |
Source: Ministry of Statistics & Programme Implementation.